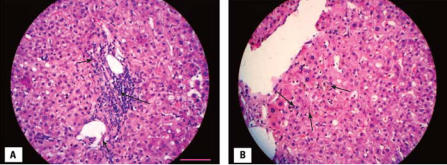
Figure 2.
QpE-induced hepatotoxicity indicated by (A) Moderate portal inflammatory infiltrates consisting of neutrophils, lymphocytes (long arrow), and eosinophils (short arrows), and (B) moderate intralobular cholestasis (arrows). Slides are stained with hematoxylin and eosin. Bar = 100 μm and applies to (A) and (B).

