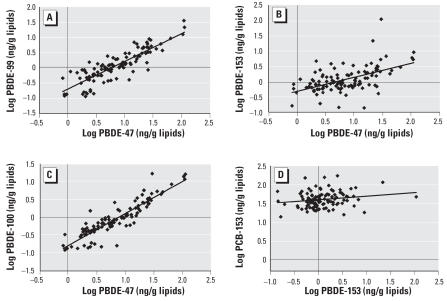
Figure 1.
Correlations between plasma concentrations of PBDE-47 and PBDE-99 (A; Pearson’s r = 0.86; p < 0.001), PBDE-153 (B; Pearson’s r = 0.53; p < 0.001), and PBDE-100 (C; Pearson’s r = 0.90; p < 0.001; n = 110 for each) and between PBDE-153 and PCB-153 (D; Pearson’s r = 0.19; p < 0.046; n = 109) in postmenopausal women from Québec, Canada.

