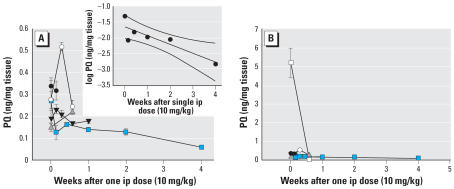
Figure 1.
Time course of PQ in ventral midbrain (VM) and liver. (A) Brain values for PQ. (B) Brain and liver values for PQ. PQ (10 mg/kg) was injected by the ip route and tissue harvested at different time points. A total of five independent time–course studies were performed with each time point from each study having sample size of four as indicated by a mean and SE for a total of 72 mice. Each type of symbol represents an independent experiment. Values in the VM (A) had greater variability at early time points (1 hr–3 days) compared with later time points (4 day–4 weeks). A plot of the log PQ concentration versus time (using the data from the experiment with the longest time point, filled squares) suggests a roughly linear decrease (r2 = 0.76, linear regression with 95% confidence interval) with a brain half-life of about 4 weeks (A). At no time point was PQ entirely eliminated from brain in contrast to liver (open square) where elimination was complete at 4 days (B; all other symbols represent VM from A). Levels in the liver (and other organs) are much higher than those in brain.

