Figure 4.
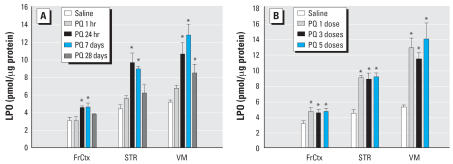
Levels of lipid peroxidation (LPO) in three brain regions after PQ exposure. The level of LPO was measured in VM, striatum (STR), and frontal cortex (FCtx) after different durations of exposure to (A) a single dose of PQ (10 mg/kg) or (B) 1 week after a total of one, three (M-W-F), or five (M-W-F-M-W) doses of PQ (10 mg/kg). Greatest effects were identified in the VM, lesser in STR, and least in FCtx, as previously reported for a single 24-hr time point. Significant effects were present at 24 hr and 7 days in all regions but were still present up to 28 days in VM. The level of LPO was not significantly increased between one and five doses of PQ. However, each region demonstrated significantly elevated LPO with VM > STR > FCtx. Each value represents a mean ± SE from four mice.
(A) *Significantly different from saline for respective region, all post hoc p < 0.005. (B) *Significantly different from saline for respective region, all post hoc p < 0.026).

