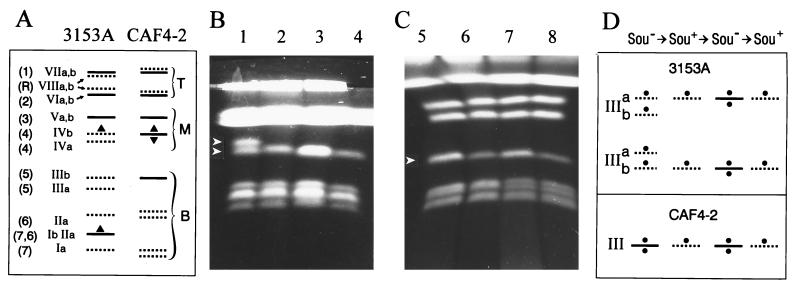
Figure 4.
(A) Schematic representation of the electrophoretic karyotypes from 3153A and CAF4–2 showing the positions of the SOU1 gene (▴ and ▾). Orthogonal-field-alternation gel electrophoresis separation of chromosomes of two typical representative sequential series of strains derived from the parental strains (B) 3153A and (C) CAF4–2. Orthogonal-field-alternation gel electrophoresis. Lanes: 1, 3153A (Sou−); 2, Sor55 (Sou+); 3, Sor55–1 (Sou−); 4, Sor55–1-1 (Sou+); 5, CAF4–2 (Sou−); 6, Sor19 (Sou+); 7, Sor19–1 (Sou−); 8, Sor19–1-1 (Sou+). Conditions of separation in these two representative gels were selected for the best resolution of either the smallest or the smallest and middle-sized groups of chromosomes (21). The gels showing precise separations of the other chromosomes of these strains are not presented. (D) Schematic representation of chromosomes III from the Sou+ and Sou− strains serially derived from 3153A and CAF4–2 showing the hypothetical negative regulator CSU1 gene (•).

