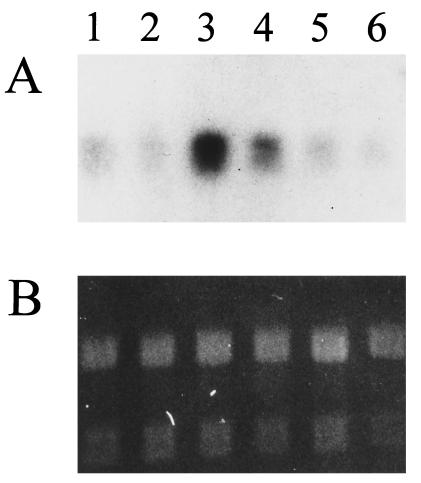
Figure 5.
(A) Expression of SOU1 as determined by Northern blot analysis with a SOU1 probe and with the following strains. Lanes: 1 and 2, parental strain 3153A (Sou−); 3, Sor52 (Sou+); 4, Sor53 (Sou+); 5, Sor52–1 (Sou−); and 6, Sor53–1 (Sou−). (B) Relative SOU1 mRNA levels were estimated by comparing the hybridization signals with the ethidium bromide fluorescence intensities of the rRNA bands.

