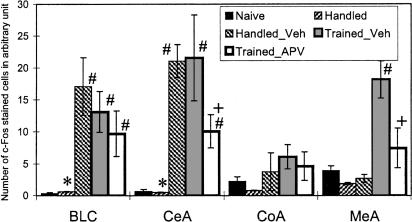
Figure 9.
c-Fos expression in basolateral complex (BLC), central (CeA), cortical (CoA), and medial (MeA) amygdalar nuclei in control and experimental groups of rats. The data represent the average number of c-Fos immunostained cells of left and right nuclei except the handled group, where the data from right (Handled) and left (Handled_Vehicle) nuclei were presented separately. (*) Significant differences between right and left (vehicle-injected) sides in group of handled rats; (#) significant differences from naive rats; (+) significant differences from Trained-Vehicle group, p < 0.05 in each case (Newman-Keuls post hoc tests; see text for results of ANOVAs).

