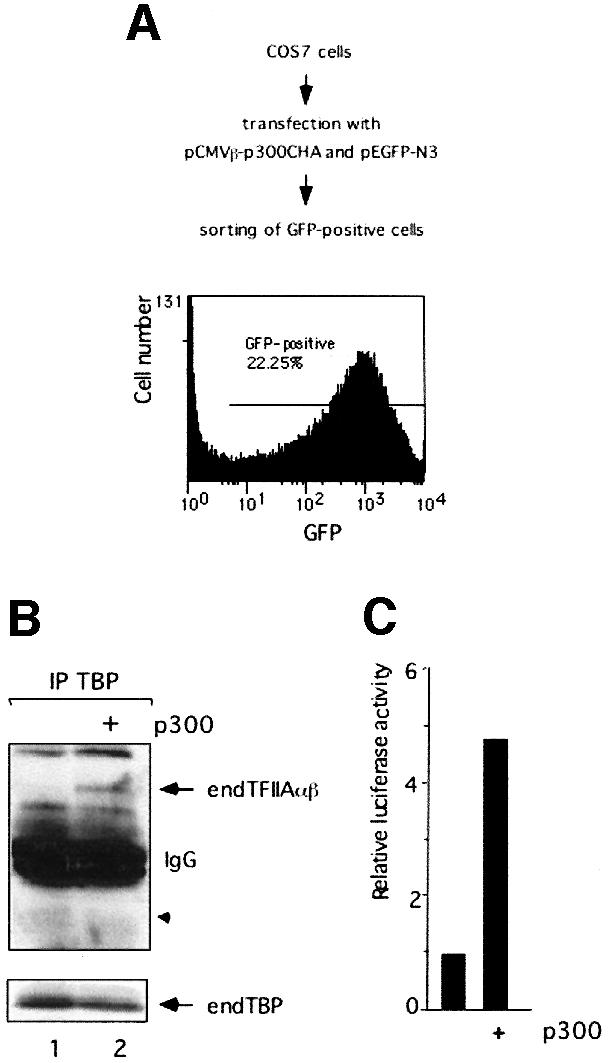
Fig. 7. Formation of native TAC upon expression of p300 in COS7 cells. (A) FACS analysis of COS7 cells co-expressing p300 and GFP, and sorted by FACS based on GFP expression. By selecting optimal parameters, a fraction of positive cells that was >95% pure was obtained. (B) Expression of p300 results in formation of native TAC in COS7 cells. Cell extracts were subjected to immunoprecipitation using the anti-TBP antibody SL27. Lane 1, non-transfected COS7 cells; lane 2, COS7 cells transfected and sorted as described in (A). Western blot analysis was performed using antibodies against TFIIAαβ (α-specific) and TBP (SL39). endTFIIAαβ and endTBP represent endogenous proteins. (C) Native TAC formed in COS7 cells upon expression of p300 is transcriptionally active. COS7 cells were transfected with the Gal4-TATA-luc reporter, the pSV2-CAT internal control plasmid and the expression plasmid encoding HA-tagged p300. Luciferase values were expressed as in Figure 1D.
