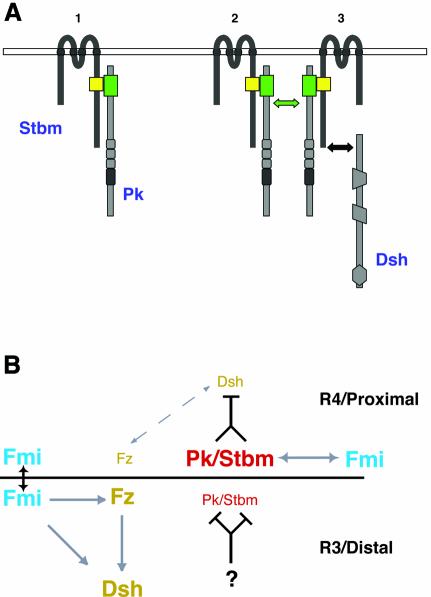
Fig. 7. A model for Stbm/Pk protein clustering and PCP signaling circuitry. See also text for details. (A) Model of how Stbm recruits Pk to the cell membrane (1) leading to its clustering (2). The complexes might then sequester Dsh from Fz signaling (3) and potentially target it for degradation. (B) In the R3 cell and on the distal end of a wing cell, Fz/Dsh signaling is high. Pk/Stbm is inhibited/prevented from influencing Fz/Dsh by an unknown factor. On the R4 side of the R3/R4 cell boundary and the proximal side of a wing cell, Pk/Stbm can counteract Fz/Dsh signaling (dashed arrow). Arrows: genetic (gray) and physical (black) interactions between planar polarity genes. The gene names are color coded according to their localization. See text for details.

An official website of the United States government
Here's how you know
Official websites use .gov
A
.gov website belongs to an official
government organization in the United States.
Secure .gov websites use HTTPS
A lock (
) or https:// means you've safely
connected to the .gov website. Share sensitive
information only on official, secure websites.
