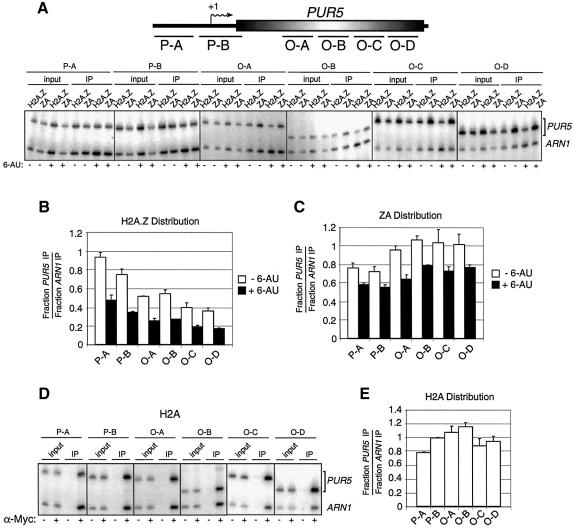
Fig. 5. Localization of H2A.Z, ZA and H2A at the PUR5 locus. (A) Top: representation of the PUR5 locus. Regions amplified by PCR in the promoter region (P-A and P-B) or in the open reading frame (O-A to O-D) are represented. Bottom: ChIP analysis of the binding of H2A.Z and ZA at the PUR5 locus. All PCRs contain ARN1 primers used here as an internal control to normalize signals for each lane. (B and C) Distribution of H2A.Z and ZA at the PUR5 locus. Quantification of (B) H2A.Z or (C) ZA under repressed (–6-AU, open bar) and induced (+6-AU, black bar) conditions. (D) ChIP analysis of the binding of Myc-H2A at the PUR5 locus. Cells were grown under repressed condition and chromatin was immunoprecipitated with (+) or without (–) an anti-Myc antibody. (E) Distribution of H2A over the PUR5 locus.

An official website of the United States government
Here's how you know
Official websites use .gov
A
.gov website belongs to an official
government organization in the United States.
Secure .gov websites use HTTPS
A lock (
) or https:// means you've safely
connected to the .gov website. Share sensitive
information only on official, secure websites.
