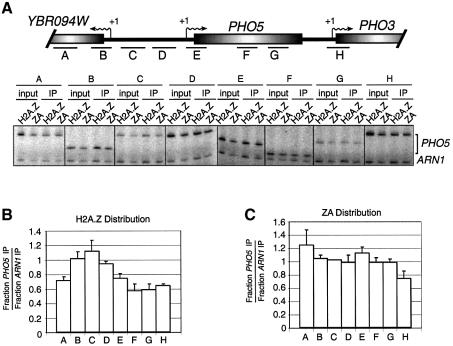
Fig. 6. Distribution of H2A.Z and ZA at the PHO5 genomic region. (A) Top: representation of a 4.3 kb genomic region spanning the PHO5 gene. The transcription start sites (arrows with +1), open reading frames (open shaded rectangle) and regions amplified by PCR (black bars) are represented. Bottom: ChIP analysis of H2A.Z and ZA binding over the PHO5 genomic region. Cells were grown under PHO5 repression conditions. All PCRs contain ARN1 primers used here as an internal control to normalize signals for each lane. (B and C) Distribution of (B) H2A.Z and (C) ZA over the PHO5 genomic region.

An official website of the United States government
Here's how you know
Official websites use .gov
A
.gov website belongs to an official
government organization in the United States.
Secure .gov websites use HTTPS
A lock (
) or https:// means you've safely
connected to the .gov website. Share sensitive
information only on official, secure websites.
