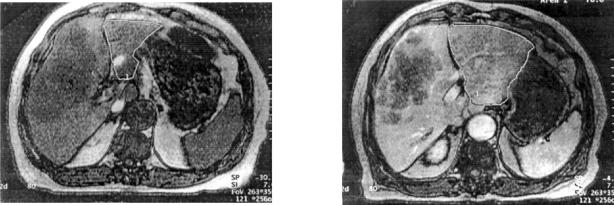
Figure 2. .
Magnetic resonance images showing (a) the tumour in the right lobe and a small left lobe prior to embolisation and (b) the corresponding scan after embolisation showing left lobe hypertrophy. Note the region of the upper pole of the right kidney for orientation of level. The appreciable hypertrophy is noted one month following embolisation.

