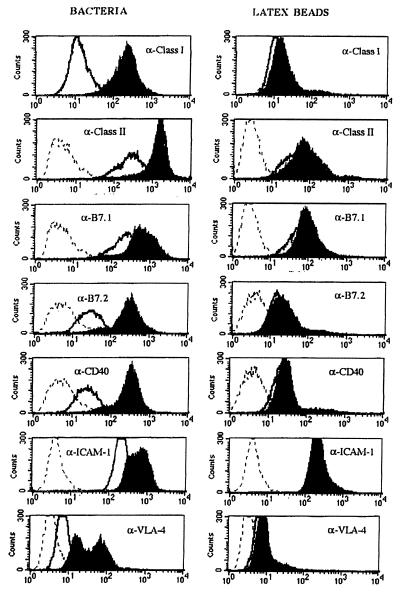
Figure 2.
Phenotypical maturation of D1 cells. FACS profiles of surface markers after incubation with S. gordonii at a ratio of 10 bacteria to 1 DC (Left) or latex beads at a ratio of 100 beads to 1 DC (Right). Histograms represent the following: filled, cells after treatment; open, untreated cells; dashed, isotype controls.

