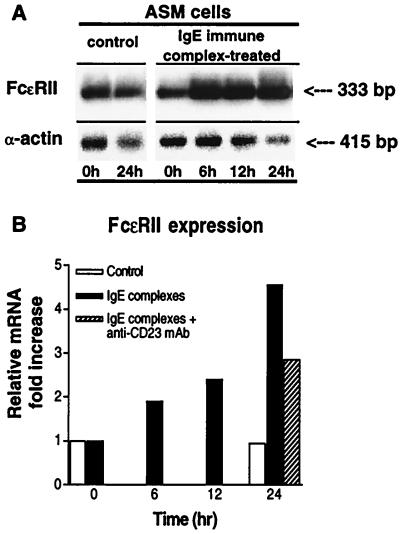
Figure 8.
(A) Comparison of expression of FcɛRII in rabbit ASM cells after 0 and 24-hr treatment with media alone (control) or with IgE immune complexes for 0, 6, 12, and 24 hr. The products of RT-PCRs with 2.5 μg of total RNA and human-specific primers for the FcɛRII receptor mRNA are shown. mRNA expression of α-actin is also shown for comparison. (B) Corresponding time-dependent changes in FcɛRII/α-actin ratio, expressed as fold increase above baseline (i.e., time 0) in control (open bars) and IgE immune complex-treated cells (filled bars). Note the progressive induction of FcɛRII mRNA expression up to 24 hr after treatment with IgE immune complexes, and inhibition of FcɛRII expression at 24 hr in the presence of anti-CD23 mAb (hatched bar).

