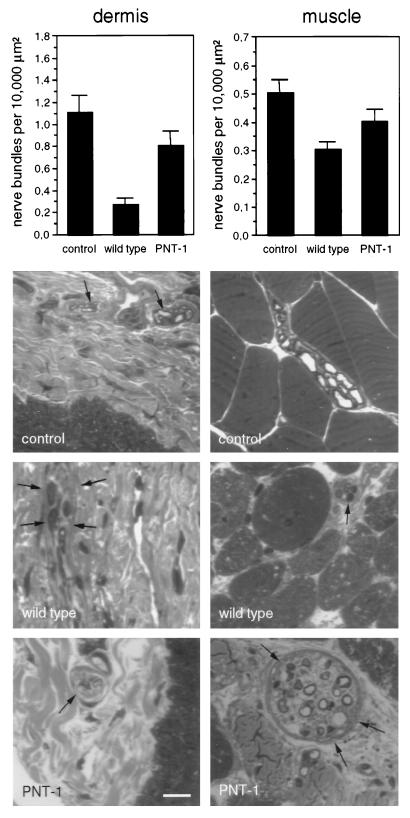
Figure 3.
Analyses of target reinnervation. The density of axonal bundles was estimated in semi-thin sections of foot pad dermis (Left) and flexor plantaris muscle (Right). In the upper graphs, the density of axonal bundles per 10,000 μm2 is indicated for unoperated nerves (control), and operated transgenic (PNT-1) and wild-type mice 5 weeks after nerve injury (n = 4). The lower micrographs show examples of semi-thin sections of dermis and muscle. Axonal bundles are indicated by arrows. (Bar = 10 μm.)

