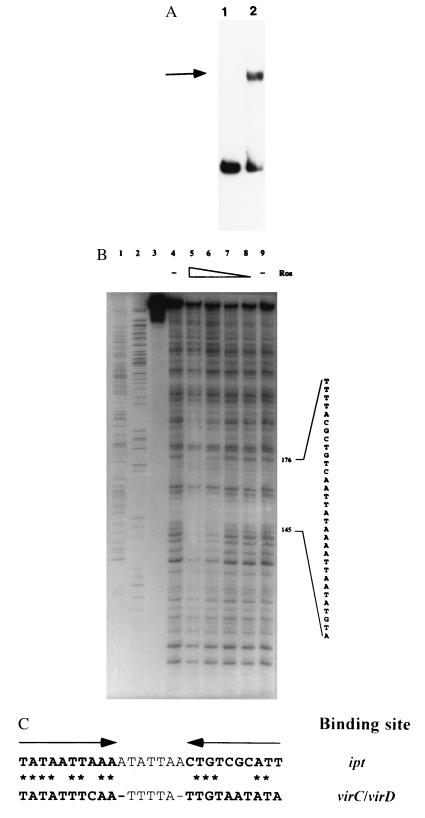
Figure 4.
(A) Gel mobility shift analysis of the binding of Ros protein to the promoter of the T-DNA ipt gene. Lanes: 1, promoter fragment of the ipt gene; 2, same fragment incubated with purified Ros protein. The shifted band is indicated by the arrow. (B) DNase I footprint analysis of the interaction of Ros and the ipt promoter fragment. Lanes: 1 and 2, A and G sequencing reaction products, respectively; 3–9, approximately 4 ng of radiolabeled DNA per lane; 3, free probe; 4 and 9, ipt promoter fragment treated with DNase I only; 5–8, ipt promoter fragment incubated with 10, 5, 2.5, and 1.25 μg of Ros protein, respectively, before treatment with DNase I. Protection against DNase I digestion by Ros was seen between bases 145 and 176 with respect to the ipt sequence (GenBank accession no. X00639). (C) Comparison of virC/D and ipt promoter binding sites for Ros. The arrows above the sequences show the position of the inverted repeat within the virC/D promoter. Asterisks indicate identical base-pair matches between the ipt and virC/D Ros binding sites.

