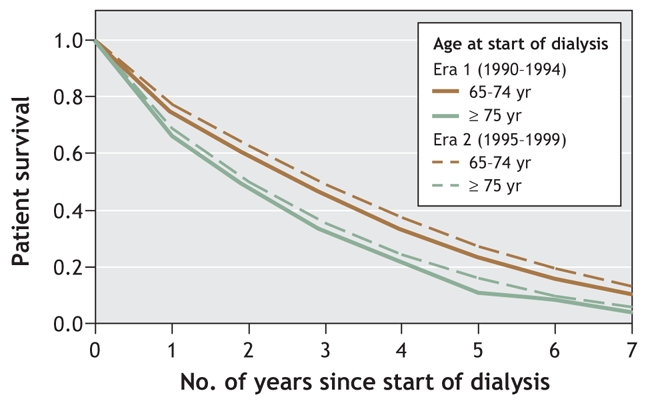
Figure 1: Survival curves for patients aged 65–74 years and those aged 75 or more who began dialysis during 1990–1994 (era 1, solid lines) and 1995–1999 (era 2, dotted lines). Curves have been adjusted for sex; presence or absence of baseline cerebrovascular disease or peripheral vascular disease; previous myocardial infarction or coronary artery bypass surgery; diabetes at time of starting dialysis; neoplasia at time of starting dialysis; and initial dialysis modality.
