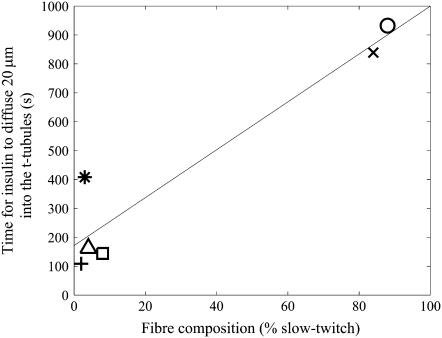
FIGURE 5.
The predicted times for insulin to reach 0.75 nM at a location 20 μm from the sarcolemma after the insulin injection as a function of muscle fiber composition. The skeletal muscles are rat adductor longus (○), soleus (X), quadriceps (□), EDL (∗), anterior tibialis (+), and medial gastrocnemius (▵). Also shown is a linear regression fit to these insulin travel times that explains 90% of the variance (—).

