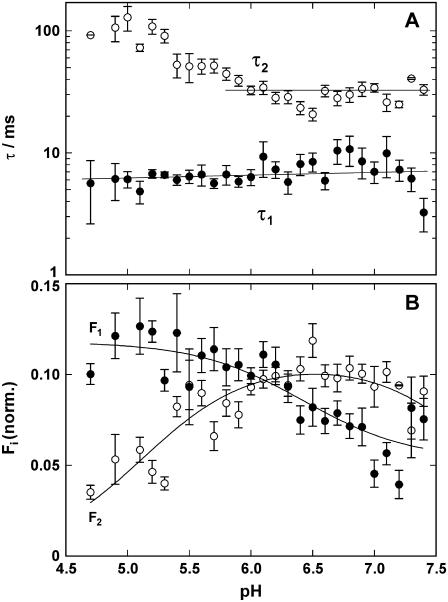
FIGURE 6.
Analysis of pH jump experiments in the absence of CaCl2. The time course of the fluorescence decrease was fitted with the sum of two exponentials (Eq. 1), and (A) the time constants, τi, and (B) amplitudes, ΔFi, were plotted against the electrolyte pH after the pH jump. The UV-flash-induced release of protons was ∼0.125 μM, independent of pH in the buffer. (A) The faster of the two rate-limiting processes, controlled by τ1 is not significantly dependent on pH in the pH range covered by the experiments. The slower process is decelerated below pH 6 with increasing proton concentrations. (B) The fluorescence amplitude revealed a pH dependence for both processes. Since it reflects binding of protons to the Ca-ATPase, it is obvious that below pH 6 the faster process carried more protons into the membrane domain than the slower one. Above pH 6 it was vice versa.

