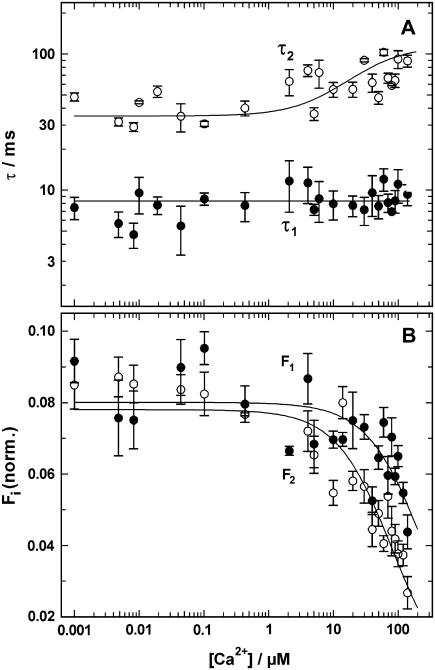
FIGURE 7.
Ca2+-concentration dependence of the pH jump induced fluorescence relaxation. Experiments as shown in Fig. 5 were performed in the presence of various Ca2+ concentrations. The time course of the fluorescence signal was fitted with the sum of two exponentials (Eq. 1). The time constants, τi, and the fluorescence amplitudes, Fi, were plotted against the concentration of free Ca2+ in the electrolyte. (A) The time constant of the fast process, τ1 = 8.3 ms, was Ca2+-concentration independent whereas the slower process was decelerated at Ca2+ concentrations above 1 μM. (B) The amplitude of both components of the fluorescence signal decreased at concentrations >5 μM. Above 400 μM Ca2+ no significant fluorescence changes could be detected.

