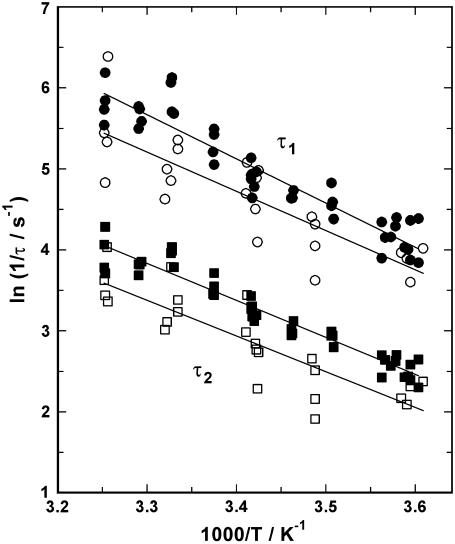
FIGURE 9.
Temperature dependence of the relaxation time constants. The experimentally determined time constants, τ1 (circles) and τ2 (squares), are shown as an Arrhenius plot. The flash-induced pH jump experiments were performed in the absence of Ca2+ (solid symbols) or in the presence of 50 μM free Ca2+ (open symbols). The lines drawn through the data are linear regression fits, and the absolute value of their slopes is proportional to the activation energy of the rate-limiting process.

