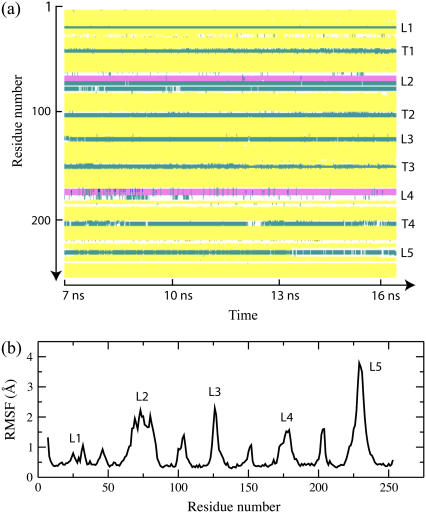
FIGURE 11.
Secondary structure and RMSF of the consensus model of OpcA simulated in a lipid bilayer. (a) The secondary structure of OpcA during the 9-ns segment of the MD trajectory. The plot covers the time interval from 7 to 16 ns referred to in Fig. 10. The y axis of the plot indicates the OpcA residue by number, while the x axis shows the simulation time. The following secondary structure elements are identified by color: β-sheet (yellow), cord (white), turn (cyan), and α-helix (pink). The secondary structure analysis was performed using STRIDE (40). (b) RMSF of the protein α-carbon atoms during the ∼9-ns of the simulation. Loops are labeled L1–L5.

