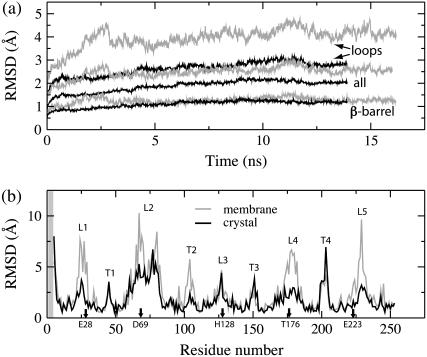
FIGURE 4.
RMSD of the in surfo structure simulated in a lipid bilayer (gray) and in a protein crystal (black). (a) Time-dependence of the RMSD of the protein backbone from the x-ray coordinates of the β-barrel, extracellular loops, and the entire protein. (b) Per-residue RMSD of the protein backbone from the x-ray coordinates, averaged over the last nanosecond of each simulation. The extracellular loops and periplasmic turns, respectively, are labeled L1–L5 and T1–T4. The shaded region indicates residues missing in the x-ray structure.

