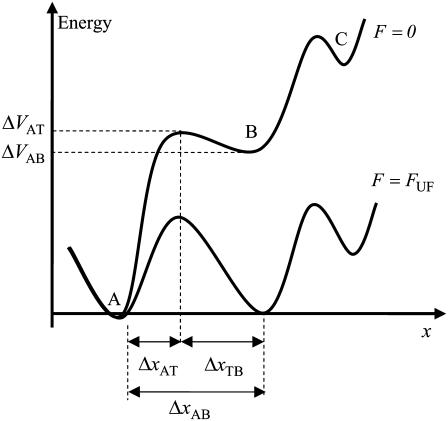
FIGURE 1.
Schematic energy landscape diagram of the interactions between neighboring units elongated along the long axis of the pilus rod (the reaction coordinate, denoted by x). State A represents the closed layer-to-layer bond, state B the head-to-tail interaction that makes up the backbone of the rod. The position of the maximum of the energy landscape curve between the states A and B are referred to as the transition state, and is denoted by t. The uppermost curve represents the energy landscape for a pilus not exposed to any force, whereas the lower curve refers to the case when the pilus is exposed to a force equal to the unfolding force of the quaternary structure of the rod,  represents the distance from the minimum of state A (in the presence of a force) to the transition state, whereas
  is the distance from the transition state to the minimum of state B.
  represents the bond opening length along the reaction coordinate. The energies
  and
and  are those of the energy barrier and the difference between state A and B, respectively. State C represents an alternative configuration of the head-to-tail bond.

