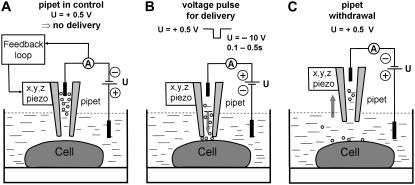
FIGURE 4.
Schematic of the experiment showing how the probe molecules are delivered to a defined position on the sperm cell surface using the nanopipette. (A) The pipette is controlled at 100 nm distance from the cell membrane at positive potential (electrode in the bath) so that the probe molecules do not exit. (B) A negative voltage pulse is applied to deliver molecules to the cell membrane, distance control is switched off for the duration of the pulse, and fluorescence imaging starts. (C) The pipette is withdrawn rapidly at positive potential to prevent further molecules exiting the tip; fluorescence imaging continues.

