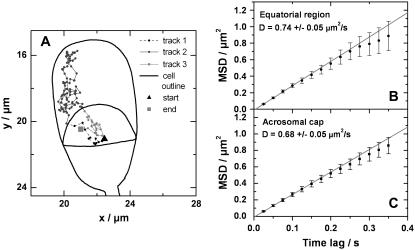
FIGURE 8.
(A) Trajectories crossing the boundary between anterior acrosomal cap and equatorial segment were divided into different tracks. The tracks in the anterior acrosomal cap and equatorial segment were analyzed separately. (B and C) Plots of the averaged MSD curves. The diffusion coefficients were calculated from the slope of a fit to the first five data points.

