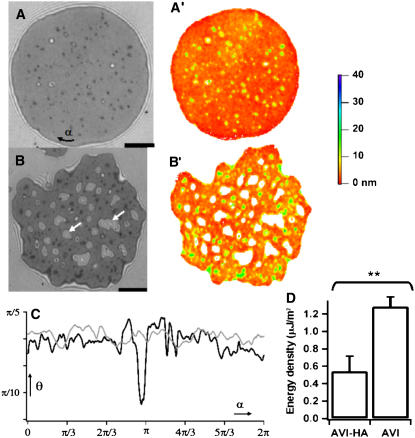
FIGURE 6.
(A and B) RIC micrographs of vesicles adhered to substrates coated with avidin and with hyaluronic acid coupled via avidin (avi-HA). A′ and B′ are the corresponding average height maps determined using branch 1 of Eq. 2 (see also Fig. 4). The color represents vertical height that goes from 0 to 40 nm. The parts of the membrane that are higher than 40 nm (where the height calculation should be done in another branch), are painted white. Note that the dark patches in RIC micrograph (with intensity lower than the average intensity in the adhesion disk) correspond to larger heights. (C) The spatial distribution of the contact angle along the rim of the adhesion disk for substrates coated with avidin (shaded) and with avi-HA (solid). (D) Adhesion energy density (mean average ± SE of distribution) on substrates coated with avidin and with hyaluronic acid coupled via avidin. (Unpaired t-test reveals significant difference.) Scale bar = 5 μm.

