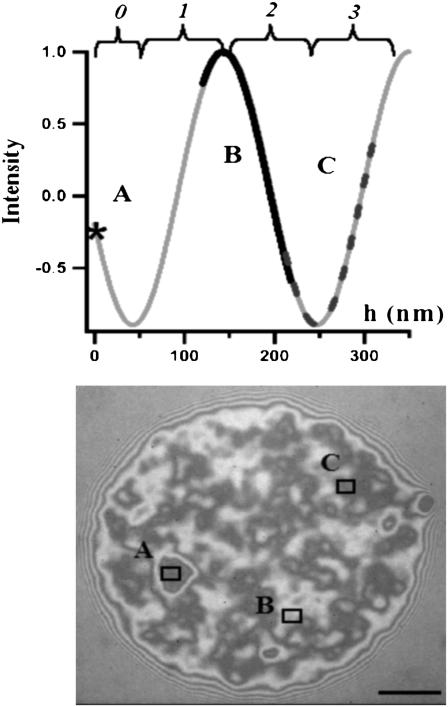
FIGURE 9.
The theoretically expected intensity as a function of membrane-substrate distance (h) for given nin and nout (= 1.332 and 1.342, respectively) and RIC micrograph of a vesicle decorated with PEG partially adhered on a substrate with thin hyaluronan cushion. At patch A, the membrane height is at the limit of the instrument resolution and the height fluctuation is of the order of the noise (marked by * in the sinusoid). At patch B, branch 2 of the sinusoid (see Eq. 2) has to be used, and the height ± fluctuation is 170 ± 50 nm (thick line). At patch C (height 260 ± 50 nm, dashed line), branch 3 is used. For determining the relevant branches for the free part of the membrane, two-color RICM (wavelengths 546 nm and 436 nm) was used. Scale bar = 12.5 μm.

