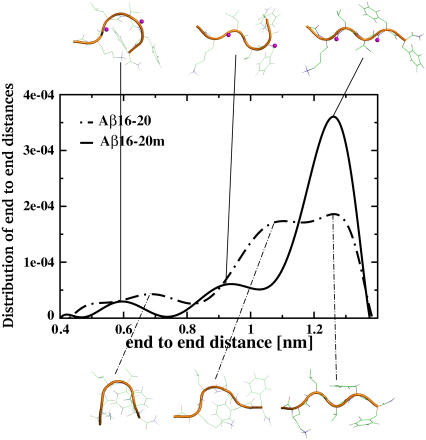
FIGURE 1.
Plot of the distribution of the end-to-end distance and of the central structures of the most populated conformational clusters of the Aβ16–20 and Aβ16–20m peptides. The N-methyl groups are highlighted in magenta. There is a clear peak in the end-to-end distance distribution of the Aβ16–20m peptide indicating that this peptide resides preferentially in an extended conformation. This dominant conformation exhibits a relative population of ∼50% for the peptide ensemble sampled.

