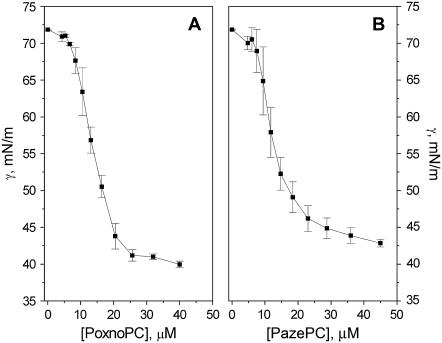
FIGURE 2.
Surface tension γ versus concentration of (A) PoxnoPC and (B) PazePC in 20 mM Hepes, 0.1 mM EDTA, pH 7.4. Values in Table 1 were obtained by fitting the Gibbs adsorption isotherm to the measured data. Experiments were carried out at ambient temperature of ∼23°C. The data points represent the mean of three or four measurements with the respective standard deviations.

