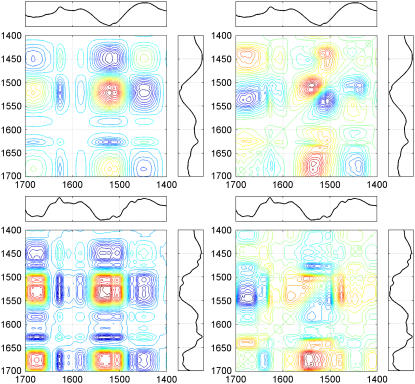
FIGURE 7.
Synchronous (left) and asynchronous (right) correlation maps corresponding to the deuteration of StnII (top) and membrane-bound StnII (bottom) in the 1700–1400 cm−1 region. The difference spectra (last spectrum in the series minus the spectrum recorded before deuteration) are indicated for reference purposes. In the correlation maps, red coloring indicates positive peaks, whereas negative peaks are in blue.

