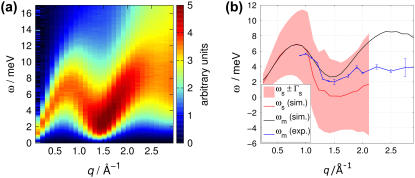
FIGURE 8.
(a) Longitudinal spectrum Cℓ(q, ω) normalized with respect to its maximum in the case of a free gas, Cℓ,f (q, ωm). (b) Dispersion curve ωm(q) determined by inelastic neutron scattering (blue) and extracted from the simulation (black), and sound mode frequency ωs(q) determined by a fit to the three-effective-eigenmode model (red). The width of the sound modes are indicated as a red-shaded area of width 2Γs(q) at around ωs(q).

