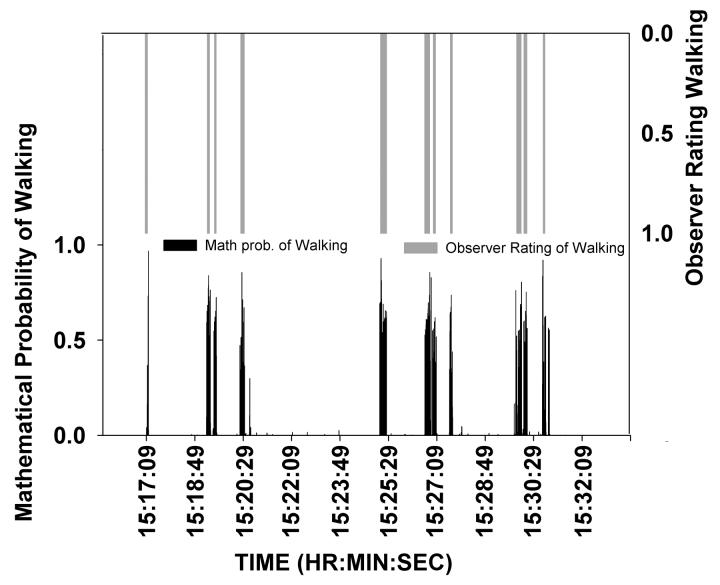
Figure 6. Observed walking and entropy-derived probability.
The close correspondence between walking behavior as observed by video ratings (gray line) and entropy-derived probability of walking (black line) for one healthy human subject across a 15-minute session in the human BPM. The entropy-derived probability of walking corresponded exactly to the observed walking at each time-frame.

