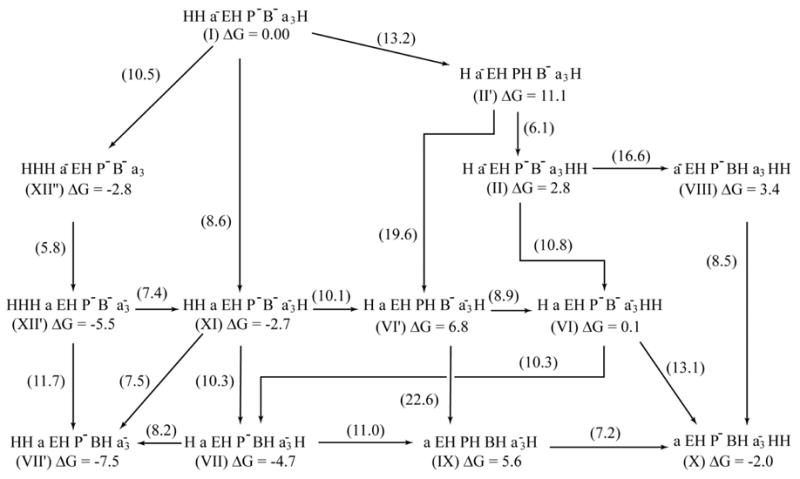
Fig 7.

An alternative two dimensional representation of the energetic of Fig. 4a. This diagram makes it easy to see the problems with the back reactions. The figure gives in the middle of each arrow the absolute height of the top of the barrier relative to the energy of state I. The figure also gives the free energy of each state.
