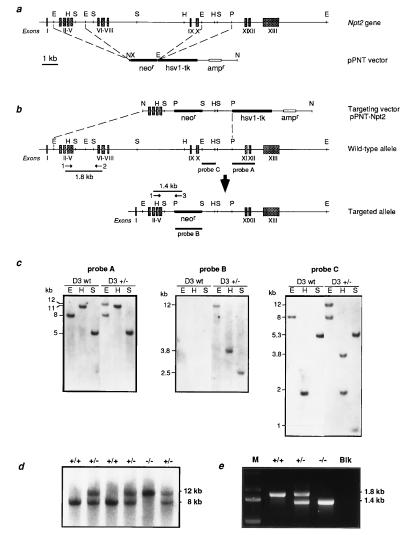
Figure 1.
Targeted disruption of the murine Npt2 gene. (a) Production of the pPNT–Npt2 targeting vector. (Upper) Schematic representation of the murine Npt2 gene, with exons numbered and denoted as grey boxes. (Lower) pPNT vector containing the neor and hsv-tk genes. The broken lines indicate sites where the Npt2 homologous arms were inserted. Relevant restriction enzyme sites are abbreviated as follows: E, EcoRI; H, HindIII; N, NotI; P, PstI; S, SstI; X, XhoI. (b) Targeting of Npt2 by homologous recombination. The top line represents the incoming pPNT–Npt2 targeting vector, the middle line the normal Npt2 allele, and the bottom line the targeted allele. The location of the probes used in Southern blot analysis are indicated. Probe A, 1.5-kb fragment external to the targeting vector; probe B, corresponding to the neor gene; probe C, a 0.8-kb fragment used as an internal probe. (c) Southern blot analysis of targeted ES cell clones. Genomic DNA (5 μg) derived from untransfected ES cells (D3 wt) or from targeted clones (D3 +/−) was digested with EcoRI (E), HindIII (H), and SstI (S), Southern blotted, and hybridized with probes A, B, and C, as shown. The sizes of genomic DNA fragments expected from the normal and disrupted alleles are indicated. (d) Genotyping of 3-week-old offspring from heterozygous matings by Southern blot analysis. Probe A was hybridized to EcoRI-restricted tail genomic DNA. Wild-type (+/+) and heterozygous (+/−) animals exhibited an 8-kb band that is absent in homozygous mutant (−/−) mice. Disruption of the Npt2 allele produced a 12-kb band. (e) PCR analysis of mouse tail DNA from wild-type (+/+), heterozygous (+/−), and homozygous mutant (−/−) mice. Positions of the primers used for the PCR and the expected sizes of amplified fragments are indicated above the corresponding alleles in b. M, size markers; Blk, negative control.

