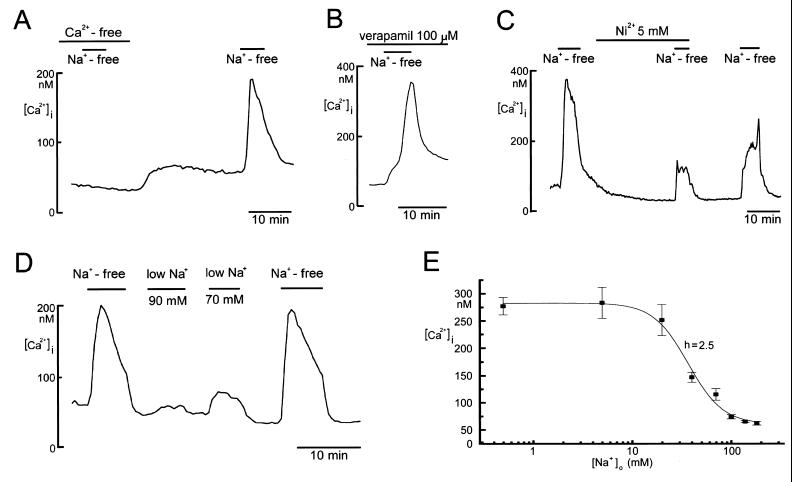
Figure 3.
[Ca2+]i changes upon deprivation (A–D) or reduction (D and E) of extracellular Na+ in single rat hepatic stellate cells cultured for 7 days. In A–C, Fura-2 measurements were performed in the nominal absence of Ca2+, in the presence of 100 μM verapamil and in the presence of 5 mM Ni2+, respectively. The data shown in B and C is representative of 5 and 15 separate experiments, respectively. In E, the mean peak [Ca2+]i values were plotted against the extracellular Na+ concentration ([Na+]o). A smooth line represents a best fit to the Hill equation with the Hill coefficient (h) of 2.48 ± 0.55. Vertical bars indicate SEM (n = 16–147).

