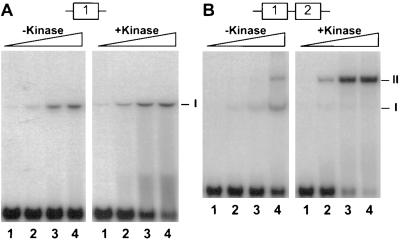
Figure 2.
Comparison of OmpR binding to a single site vs. two adjacent sites. (A) Binding of OmpR to the single site F1. Approximately 0.23 nM of the labeled DNA fragment (F1) was incubated with different amounts of OmpR in the absence or presence of 0.63 μM of the kinase MBP-EnvZ. The concentrations of OmpR used in this analysis were as follows. Lanes: 1, 9.4 nM; 2, 18.8 nM; 3, 37.6 nM; and 4, 75.2 nM. (B) Binding of OmpR to the two adjacent sites, F1 and F2. Approximately 0.23 nM of the labeled DNA fragment (F1-F2) was incubated with different amounts of OmpR in the absence or presence of 0.63 μM of the kinase MBP-EnvZ. The concentrations of OmpR used in this analysis were as follows. Lanes: 1, 9.4 nM; 2, 18.8 nM; 3, 37.6 nM; and 4, 75.2 nM. The OmpR/DNA complexes were resolved on a nondenaturing gel containing 10% polyacrylamide (30:1; wt/wt, acrylamide to bisacrylamide) followed by autoradiography. The positions of the OmpR/DNA complexes containing one site (I) or two sites (II) occupied are indicated.

