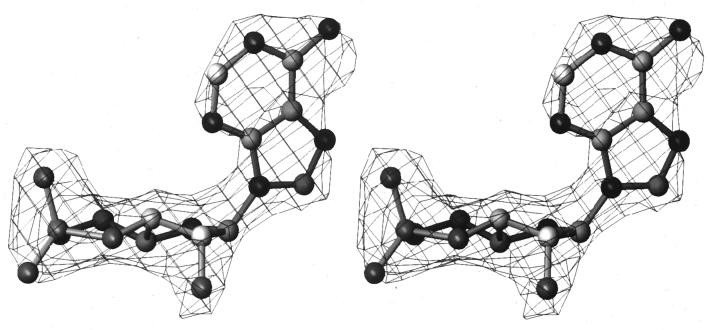
Figure 2.
Stereo view of the 2Fo-Fc “omit” electron density map at 2.2 Å resolution from which the syn-cAMP (ball-and-stick) was first identified. The density, contoured at 1.2 σ, was computed using experimentally determined phases from 25 to 8 Å and phases from 8 to 2.2 Å derived from the protein and DNA coordinates alone before any coordinates of the syn-cAMP were included in the phase and amplitude calculation.

