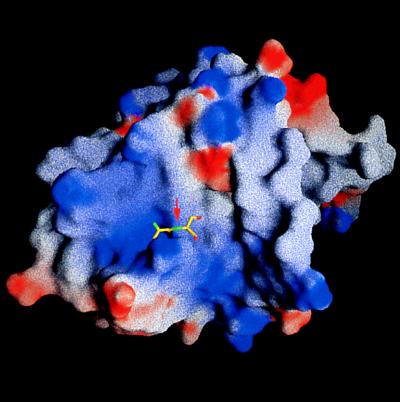
Figure 5.
Molecular surface of the VZV protease looking into the postulated substrate binding groove. The surface is color-coded by electrostatic potentials (blue for positive and red for negative) calculated with the program grasp (28). Modeled is the Ala-Ser cleavage site. The red arrow indicates the position of the scissile bond.

