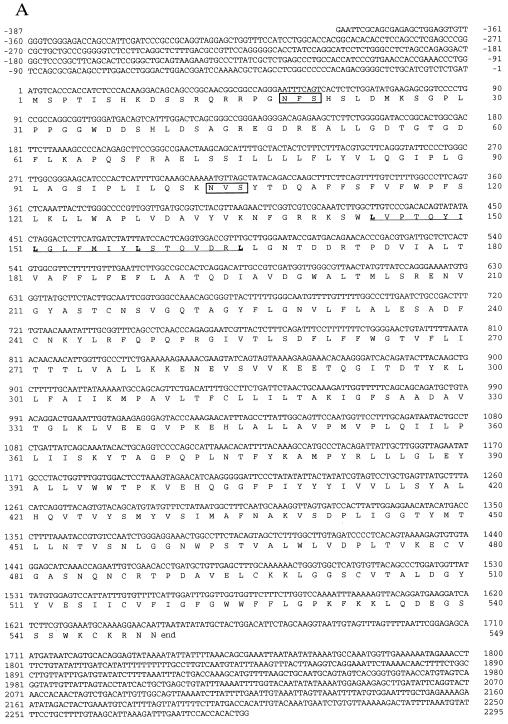
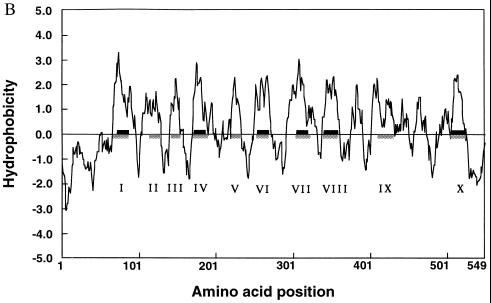
Figure 2.
Nucleotide sequence and the predicted amino acid sequence of AT-1 protein (A) and hydropathy plot (B). The putative leucine zipper motif is marked with an underline in A. The potential N-glycosylation sites are boxed in A. Hydropathy plot of the amino acid sequence was analyzed by the method of Kyte and Doolittle (18) with a window size of 10. In B, shaded and closed boxes denote the transmembrane domains predicted by tmpred and psort programs, respectively.


