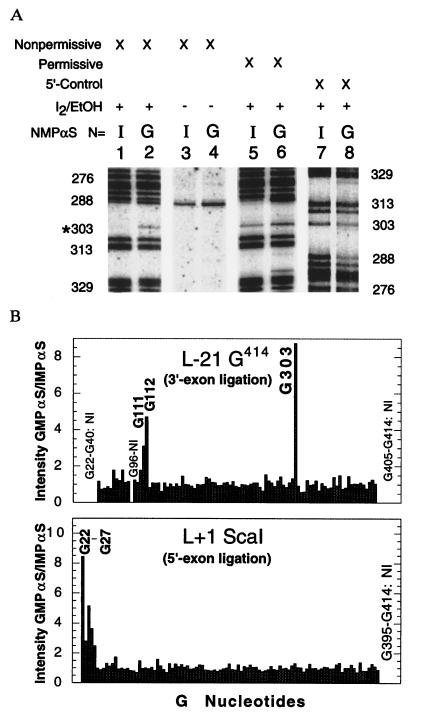
Figure 3.
(A) A portion of the sequencing autoradiogram showing the reaction of L-21 G414 IMPαS or GMPαS RNA with dT(-1)S under nonpermissive conditions (lanes 1–4) or rT(-1)S under permissive conditions (lanes 5 and 6). The nucleotide positions correlating to the cleavage products are shown to the left for lanes 1–6 and to the right for lanes 7 and 8. For the 5′ control (lanes 7 and 8), the L-21 G414 is enzymatically labeled at the 5′ end. This results in a reversal of the sequence orientation on the gel, but shows the actual level of analog incorporation at all nucleotide positions. RNA degradation independent of iodine treatment is consistently observed at A290. This is clearly seen in lanes 3 and 4. (B) Histogram showing the ratio of GMPαS intensity divided by IMPαS intensity for each position in both the L-21 G414 and L+1 ScaI RNAs when reacted under nonpermissive conditions and normalized to the actual levels of incorporation as defined by the 5′ control. Intensities were measured by PhosphorImager analysis. A value of 1 indicates that an inosine substitution at that site has no effect. A value greater than 2 indicates that inosine is detrimental, while a value less than 0.5 (not detected) would indicate that inosine substitution is advantageous at that site. Positions G22–G40 could not be accurately measured in the 5′ control, so these values were normalized using the intensity of each band under permissive reaction conditions. Thus, the magnitude of the effect at G22–G27 is a minimum estimate. All values were measured at least three times in separate experiments and are accurate to within 25% error. Sites that were not informative in the assay are indicated on the graph with the initials NI.

