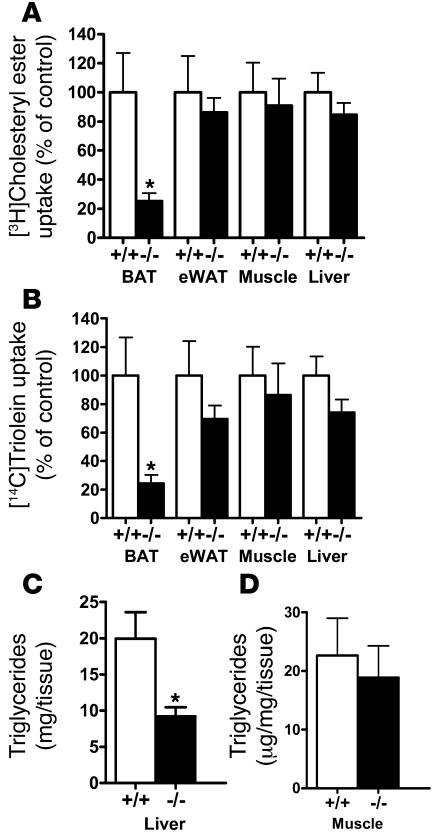
Figure 4. Tissue distribution of radiolabeled lipids after infusion with lipid emulsions containing [3H]cholesteryl ester and [14C]triolein.
Uptake of 3H (A) and 14C (B) labels into BAT, eWAT, muscle, and liver of ad-Lrp1+/+ and ad-Lrp1–/– mice (n = 5). (C and D) Triglyceride content in liver and muscle, respectively, of ad-Lrp1+/+ and ad-Lrp1–/– mice (n = 8). *P < 0.05 compared with ad-Lrp1+/+ groups.

