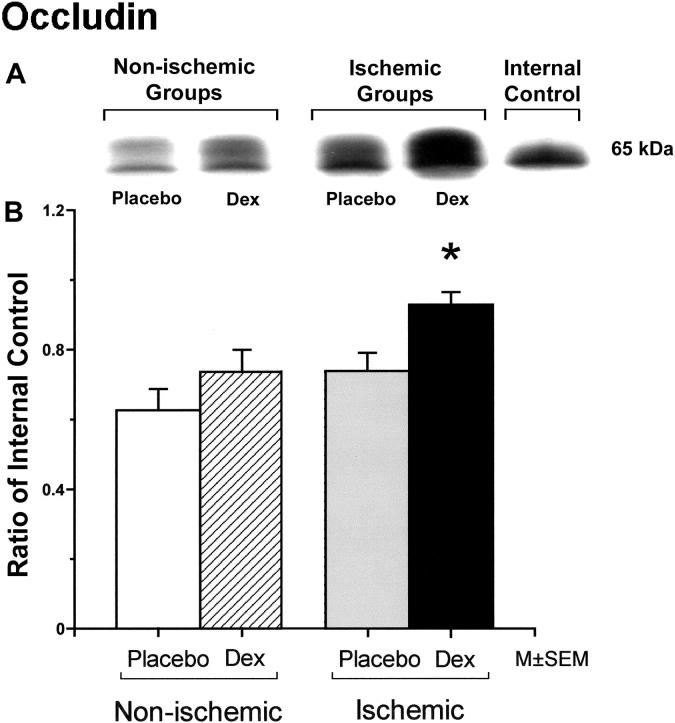
Figure 1.
Panel A shows a representative Western immunoblot of occludin protein expression in the cerebral cortex of the fetuses of placebo (Placebo) and dexamethasone (Dex) treated ewes in the non-ischemic groups on the left, and ischemic groups on the right. An internal control sample from the adult brain pool is also shown. Densitometry values from each animal represent the combined densitometry values of both bands of the phosphorylated and non-phosphorylated isoforms of the occludin protein added together. Panel B shows the occludin protein expression in the cerebral cortex plotted as a ratio of the densitometry values in fetuses of the placebo and dexamethasone treated ewes from non-ischemic and ischemic groups to the internal control samples. The open bars represent fetuses of the placebo/control group (n=7), the hatched bar the dexamethasone/control group (n=8), the gray bar the placebo/ischemic (n=5) and the solid bar the dexamethasone/ischemic group (n=5). *P<0.05 versus the to placebo/control group.

