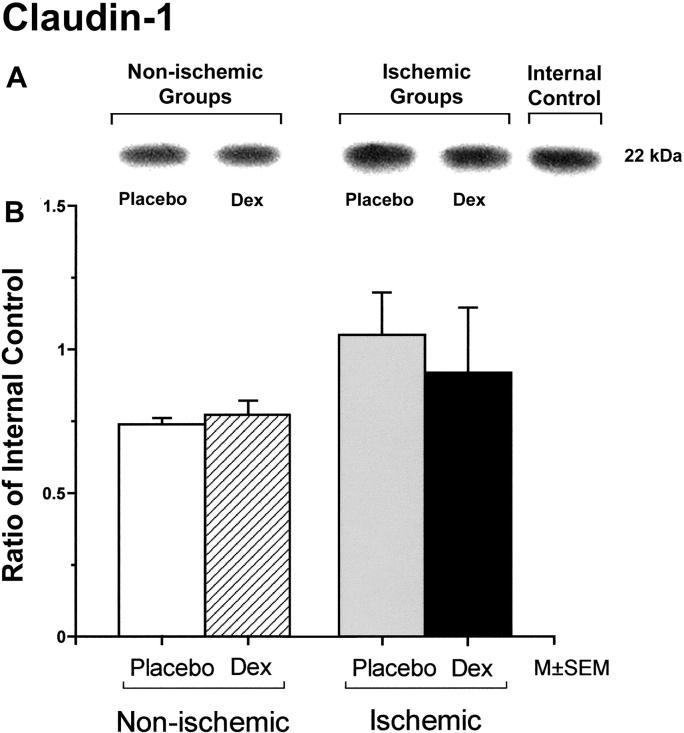
Figure 2.
Representative Western immunoblot and bar graph of claudin-1 protein expression in the cerebral cortex of the fetuses of placebo (Placebo) and dexamethasone (Dex) treated ewes in the non-ischemic groups on the left, and ischemic groups on the right. Bars legend as for figure 1. Open bar n=5, hatched bar n=5, gray bar n=6, and solid bar n=5.

