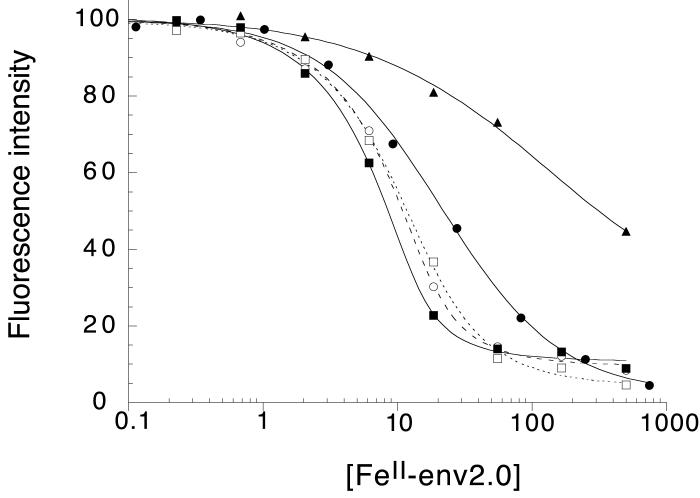
Figure 3.
Normalized fluorescence intensity as a function of FeII-env2.0 concentration measured in 96-well or 384-well plate format, for the series of peptides in Table 2. The data are fit to a standard binding curve. The curves correspond to C18-Aib (--■--), C18-WT (--○--), C18-SB (...□ ...), C16-Scr (--●--) and C16-Ala (-- --).

