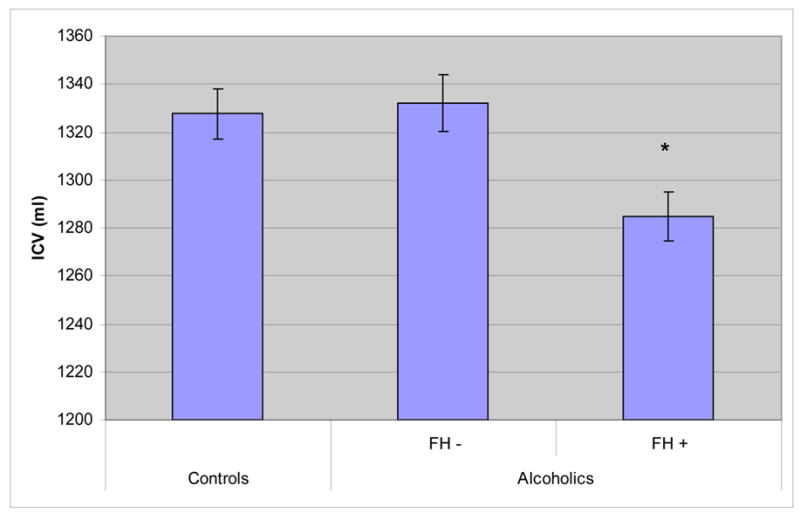
Figure 1.

Adjusted Means of ICV in Controls and Alcoholic Patients. We found a significant difference in ICV among healthy controls, FH positive, and FH negative alcoholic patients (F = 6.52, p = 0.0017). Post-hoc student’s t-tests demonstrated a significant difference between controls and FH positive alcoholic patients.
