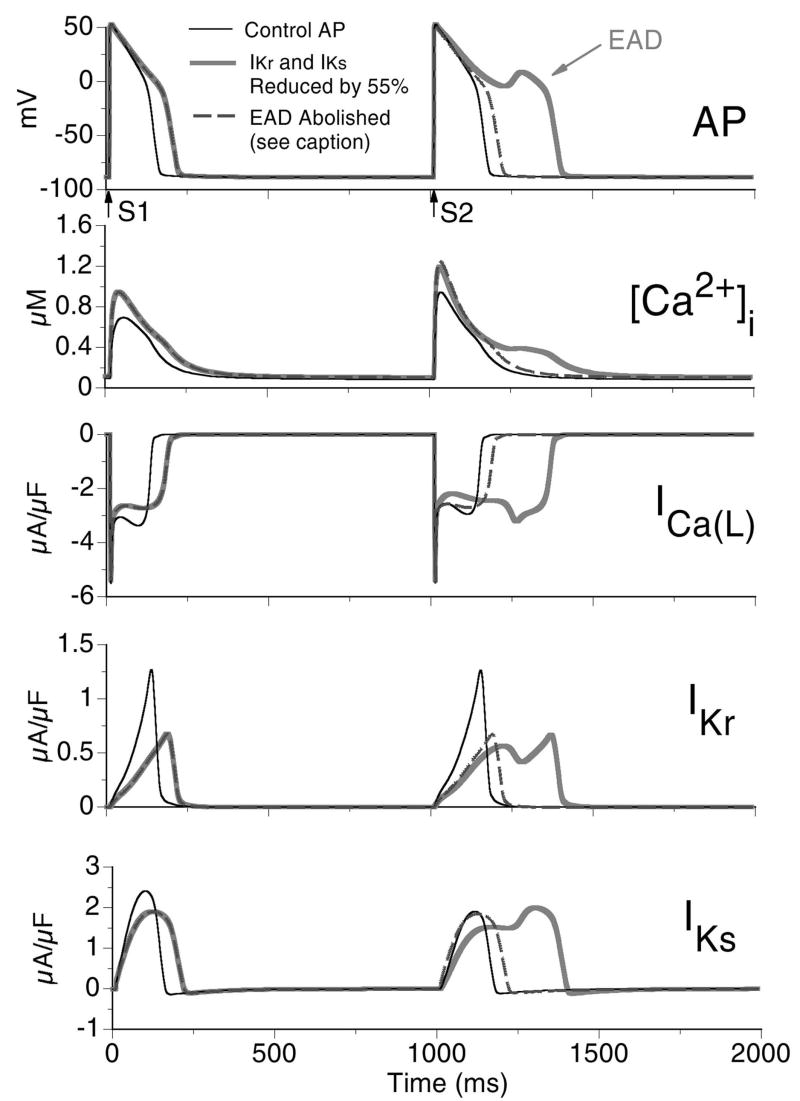
FIGURE 6.
Pause induced early afterdepolarization (EAD). The myocyte is paced for 40 beats at CL=500 ms (S1) followed by a 1000 ms pause before the next stimulus (S2). Panel A: Last paced and the post-pause APs; arrows indicate time of stimuli. Thin black trace shows control AP (pre-pause APD90=151 ms, post-pause APD90=168 ms); thick grey trace shows AP for 55% reduction of IKr and IKs (pre-pause APD90=243 ms, post-pause AP develops EAD and APD90=424 ms); dashed trace shows that the EAD is abolished by resetting IKs to its value at S1, thus preventing additional IKs deactivation during the long pause (pre-pause APD90=243 ms, post-pause APD90=229 ms). Panel B: Corresponding [Ca2+]i. Panels C, D, and E: ICa(L), IKr, and IKs, respectively.

