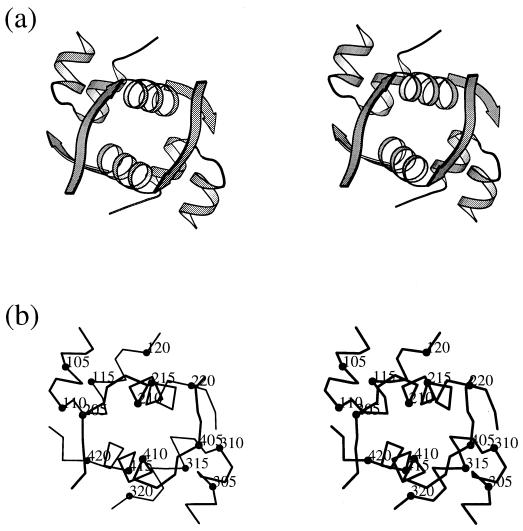
Figure 3.
The overall structure of DHPI. (a) A stereo ribbon diagram of DHPI showing view along the local 2-fold axis near (0,0,Z). (b) Stereo Cα trace of two DHPI molecules, with every fifth residue labeled in each chain. Residues are labeled as in Fig. 1. [This figure was produced using molscript (28).]

