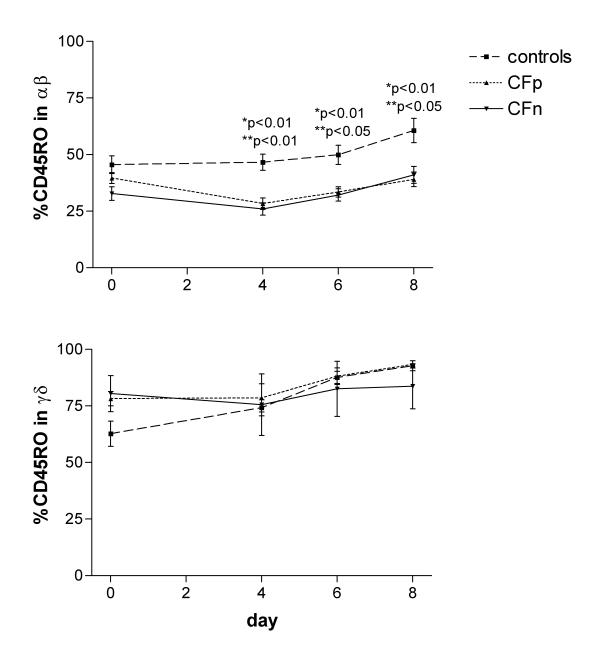
Figure 3.

Percentage of CD45RO-expressing cells in αβ T lymphocytes (top) and γδ T lymphocytes (bottom), after 0, 4, 6, and 8 days of PBMC culture with cytosolic extract from Pseudomonas aeruginosa. Surface expression of CD45RO (memory/activation marker) was detected, by three color cytometry, in 2500 gated T lymphocytes from controls (n = 17), Cystic fibrosis patients infected by PA (CFp, n = 9) and Cystic fibrosis patients not infected by PA (CFn, n = 4). Bar values correspond to mean ± standard error of the mean. (top) αβ T lymphocytes: (*) significant difference between controls and CFp, (**) significant difference between controls and CFn (ANOVA, LSD PostHoc test). (bottom) γδ T lymphocytes: significant differences were not found between groups.
