
Figure 4.
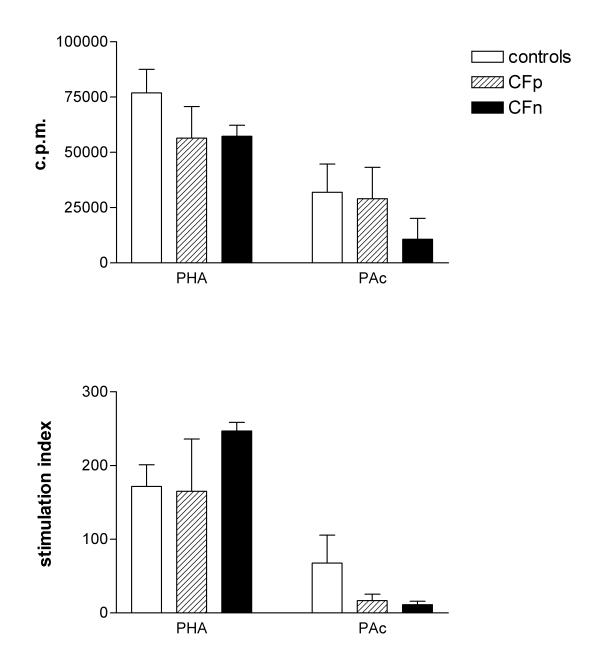
PBMC Proliferative response (3H-thymidine incorporation), expressed as c.p.m. (top) and stimulation index (bottom), after culture either with cytosolic extract from Pseudomonas aeruginosa (PAc) for 6 days or with Phytohemaglutinin (PHA) for 3 days. Significant differences were not found between controls (n = 10), Cystic fibrosis patients infected by PA (CFp, n = 9) and Cystic fibrosis patients not infected by PA (CFn, n = 4), (Kruskal-Wallis test) Bar values correspond to mean ± standard error of the mean.